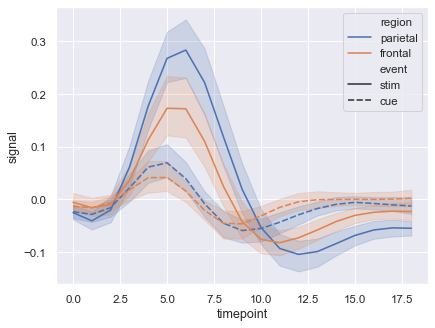
Timeseries plot with error bands
Python source code: [download source: errorband_lineplots.py]
import seaborn as sns
sns.set(style="darkgrid")

# Load an example dataset with long-form data
fmri = sns.load_dataset("fmri")

# Plot the responses for different events and regions
sns.lineplot(x="timepoint", y="signal",
             hue="region", style="event",
             data=fmri)